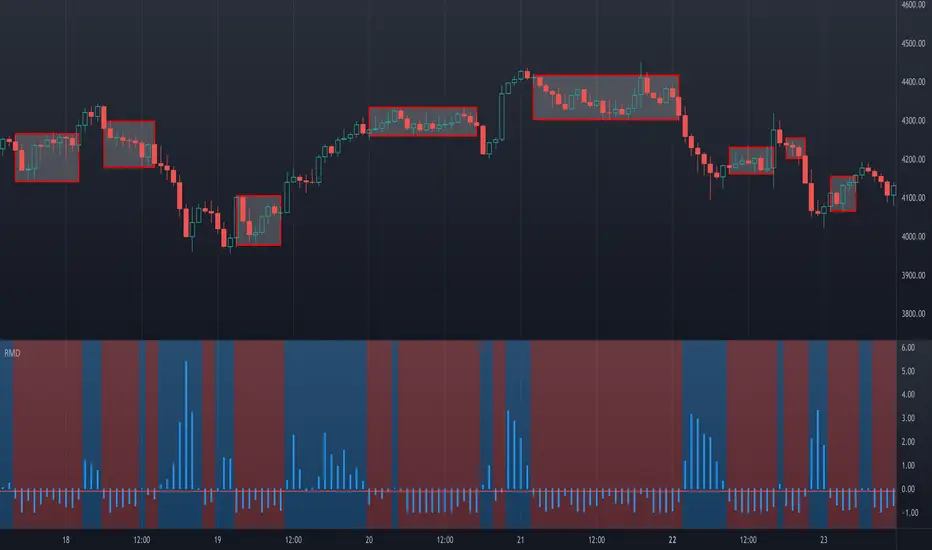
Ranging Market Detector [AstrideUnicorn]Determining if the market is in a trend or a range regime is a very complex problem. And knowing the answer can be, in some situations, the real holy grail. If the trader knows when the market is in a range regime, they can avoid overtrading and make moving average crossover strategies more profitable. A regime switch from a trend to a range can be a signal to close open positions. It can also be helpful when trading such instruments as short-term binary options. When the market is ranging directional moves are not expected, and the trader should be careful as opening a position in such conditions is, by some degree, a random outcome game. Range breakouts trading is one more example when knowing the market regime is critical.
We have created an indicator that predicts the current market regime. It smooths the price using the Kalman filter and analyzes the curve's slope. If the absolute value of the slope is low, then the market is in range mode and vice versa. To distinguish between the two regimes, the algorithm compares the absolute value of the slope with its long-term average.
HOW TO USE
The indicator shows the difference between the absolute slope value and its long-term average as a histogram. When a bar of the histogram is higher than the threshold level presented by the red line, the market is in a trending regime. In this regime, the background of the indicator is blue. When the market is in a range regime, the indicator background turns red.
The threshold level helps to control the lag. The greater it is, the more lagging the indicator will be. By default, this value is set to a negative value. It means that the indicator switches from range to trend a little bit earlier than the slope gets higher than the average slope. You can use the value of zero or low negative values to find the optimal tradeoff between the strength of the signals and their lag.
SETTINGS
The indicator has one input parameter called Threshold. It sets the threshold level described above. Its value should be close to zero. The less the value is, the less is the indicator's lag, but at the same time, the less confirmed the regime-switching signals are.
The use cases can be very different. And as the code is open, you can also use the indicator as a building block for your custom trading strategies.
Let us know your thoughts and suggestions!
In den Scripts nach "binary option" suchen
Multi-TimeFrame SignalsI trade binary options on reversals. I use this as a confluence to prove that my analysis is correct. I use this on smaller time frames given the type of trading I do.
I do not use this as an entry trigger, so you should not blindly enter trades based on this solely . You were warned
This indicator (on default settings) will let you know when the 1 minute, 3 minute, and 5 minute timeframes RSI & Stochastics are all in an overbought or oversold state. It shows this by changing the background color on your chart to red (overbought) or green (oversold).
All of these settings are changeable. #winning
I left this as open-source as I figured out how to code this by using other open-source scripts as reference. I am a programmer that uses other languages.
I only published this script as a request from a close friend.

Money Heist• This strategy is based off of Matthew Thayers Cashtrap Strategy.
• Market Timing markers based off of Evan Cabrals Market Timing Strategy.
• Psychological Support and Resistance Levels as well as 4 Hour High and Low Support and Resistance Levels.
• The Bollinger Bands will turn Red for Resistance and Green for Support when the Market is Consolidating. The bands will turn Red at the Bottom and Green at the Top when the Market is in a Heavy Trend.
• There is a 50 ema and 200 ema used to determine the trend of price and can also be used as support and resistance
• Two types of arrows can be used by heading to the settings and choosing one or the other. Either Conditional arrows based on a point system (3 being the highest) can be used or Regular CashTrap Arrows. Arrows should be used to confirm trade not as a the only reason to take a trade
PUT
Price should be below 50 EMA and 200EMA touching Top Red Bollinger Band at a Resistance level
CALL
Price should be above 50 EMA and 200EMA touching Bottom Green Bollinger Band at a Support Level
**This Strategy Is To Be Used With The Momentum RSI, Stochastic+, and RSI+**

QQE-CCI Hello guys;
This indicator is a simple combination of two oscillators "Quantitative Qualitative Estimation Signals"(based on RSI) and "Commodity Channel Index".
To summarize, the method of signaling from this indicator is that by observing the "Long" signal and CCI cross with the midline upwards simultaneously, we open the buy position; and if we see the "Short" signal and CCI cross with the midline down at the same time, we open a sell position.
I have designed this indicator for use in Binary options; 70% of the trades I have made based on this indicator signals have been successful.
I put my telegram ID here incase if U need, txt me :)
@QQECCi

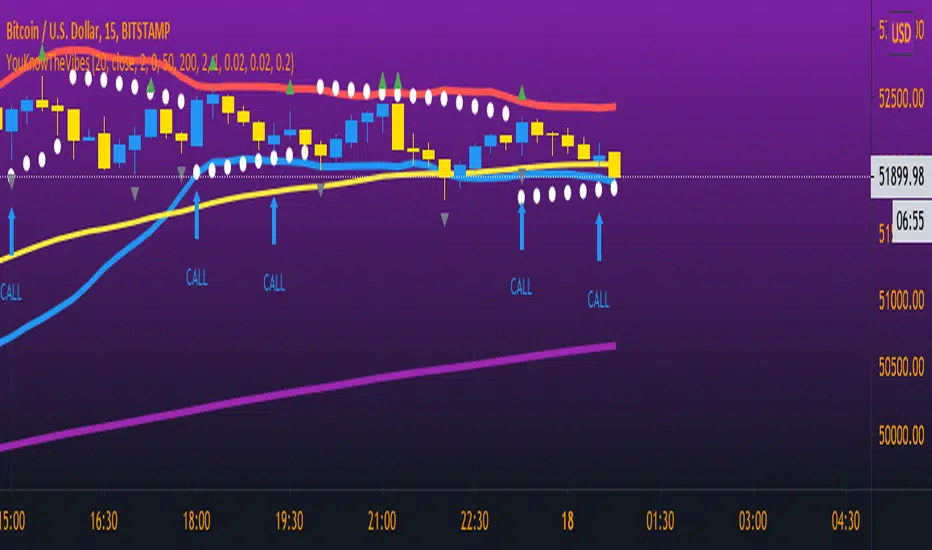
YouKnowTheVibesThis is mainly used for trading binary options but can be used for regular forex trading as well. If price is above BOTH EMAs and PSAR then you're looking for BUY opportunities. If price is below then you're looking for sell opportunities. Wait for price to break the most recent fractal high/low and retest; wait for a confirmation candle then enter a call/put and the expiry time is THREE candles.
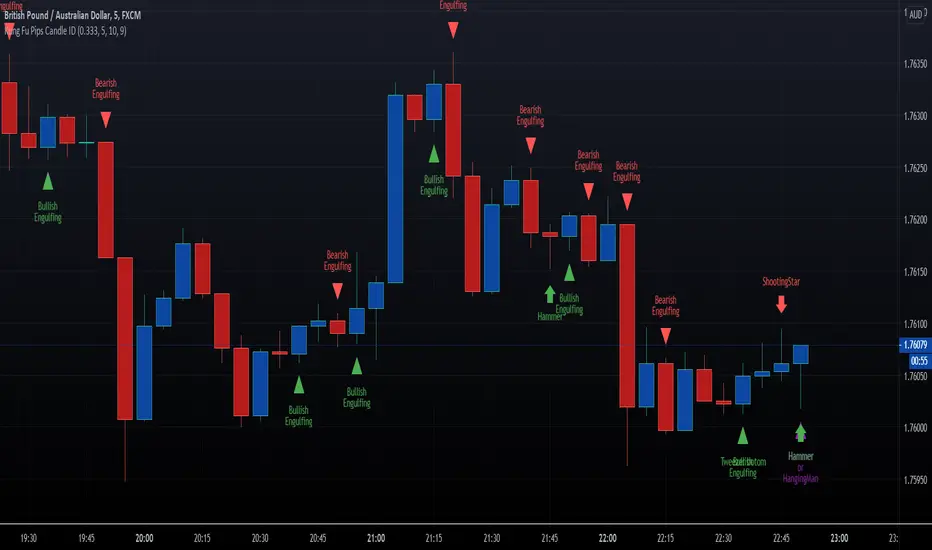
HFX Kung Fu Pips Candlestick Identifier by Trader ZThis indicator identifies the following candle stick patterns:
Bullish and Bearish Engulfing
Hammer/Hanging Man, Shooting Star
Tweezer Tops and Bottoms
Doji Star
Doji Gravestone
Made for trading Forex Binary Options but can be used in any market. When the candlestick pattern emerges the script will label the pattern. A helpful visual tool for your analysis.
Enjoy!!!!
Evan Cabral's Quarter Theory by MrTuanDoanThis indicator is based on Evan Cabral's Market Timing Strategy.
In Binary Option or High Frequency Forex (HFX), it's very common to see the market make reversals at hours and half hours.
This indicator just simply draw vertical lines at each quarter of the hour.
You should change the color and opacity to fit your chart style.
With this indicator, you're going to know when to positions yourself with more accuracy on trade setups.
Note
It works best if you take your reversal trade at the top of the hour using your other (overbought/oversold) confirmation using RSI, Stoch RSI, DMI, etc.
It works better if you take your trade at resistance/support zones
You should pay attention to the direction the market is going before the hour (or half hour) and looking at how the direction changes going into the hour or after it.
Please backtest before taking real trades

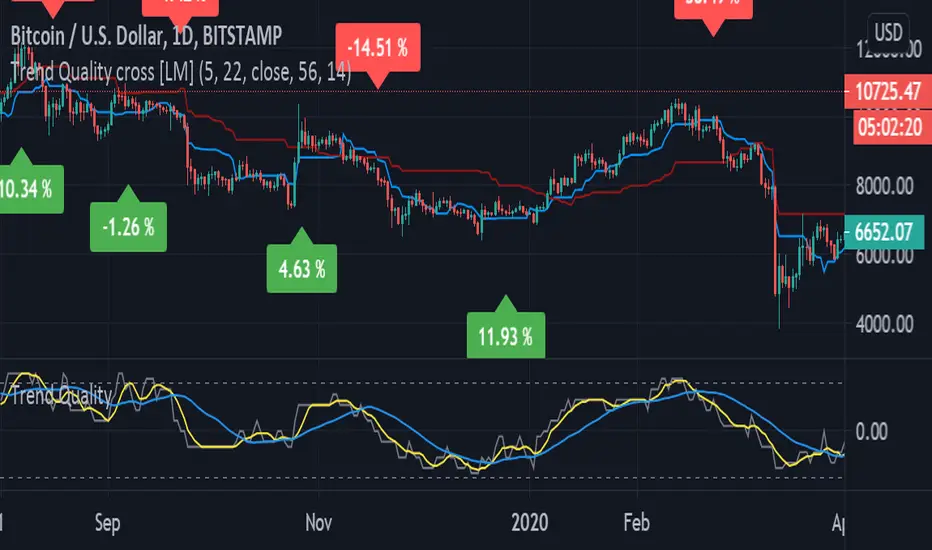
Trend Quality cross [LM]Hi Guys,
I would like to introduce you Trend quality cross indicator. The idea orginallybcomes from @kruskakli and his indicator "Trend Quality" so shout-out to him
I have modified the indicator to display just binary option buy/sell and display diff percentage from previous cross. Also there is a difference that I have double smoothed tq indicator results to give less false signals.
and also added for the same reason like in my other indicator vpci ma cross base line and conversion line from ichimoku.
Any suggestions are welcomed
Williams Fractals with Alerts by MrTuanDoanCustom William Fractals for alerts and educational purpose.
Added custom alerts for Williams Fractals.
Also added filter to show less fractals on chart.
The simple idea how I use fractals in Binary Option is to determine temporary resistance and support.
Simple strategy:
- Mark Resistance/Support on higher time frame (e.g. 5M)
- Set an alert for new fractal
- Whenever a new fractal that appears close to your marked Resistance/Support, go to lower time frame (e.g. 1M)
- Wait for rejection at the level that lower than new down fractal (or higher than new up fractal).
- Enter with the same expiry of lower time frame.
Good luck and happy trading. :-)

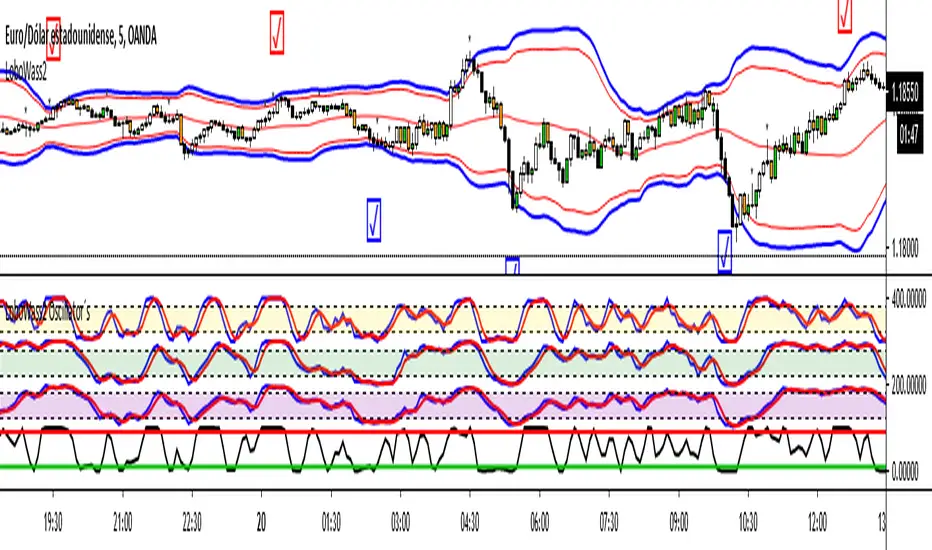
LoboWass2 Oscillator´s by Hashtag_binaryThis indicator composed of several oscillators was designed to be used with the strategy called LoboWass2 to be applied with Binary Options.
The idea of these oscillators is to be able to observe when all together appear in the same position, either overbought or oversold, and take the trade.
Remember that this is a confirmation tool, you must carry out prior analysis as your capital could be at risk. I recommend using this tool for the indicated strategy, as it was designed for that purpose. By working properly and professionally you can achieve great results, it all depends on you.
Viejito MMR2 UpperThis set will help you get better opportunities to trade binary options. When price is close to any line, use the fibonacci to get confirmation and you can take 5 minutes trades. Always analyze in 5 min timeframe

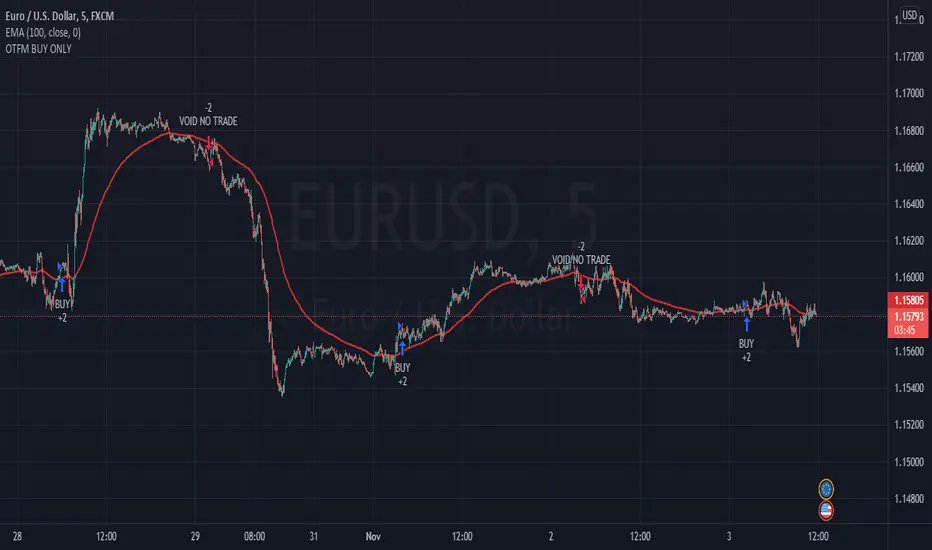
OTFMWHAT TYPE OF MARKET TO USE?
OTFM mainly uses for any forex pairs typically for scalping or Options with short-term expiry time such as hourly expiration.
HOW IT WORKS?
OTFM indicator uses a combination of moving averages and trend analysis to trigger a BUY (blue arrow pointing up) or a SELL (red arrow pointing down) signal. When certain condition is met, it will immediately pop up an alert signal for you to take. It will trigger with all types of market condition. There is no repaint since it is based of the previous closed candle.
HOW TO USE?
When the signal triggers a “BUY” or “SELL” you want to wait for that candle to close and then you enter the next candle as your entry. If you’re trading binary options, you want to take the OTM (Out the Money) contracts for low risk/ high reward and take profits once the market is going in your direction. This indicator works best when you scalp and not hold till expiry. You want to leave room for your hourly expiration typically within one hour or 2 hour. This will avoid any market reversal if it decides to go South. You can turn on push notification on your phone so you won’t have to miss any signals.
This indicator is a monthly subscription. If you’re interested in a one week free trial for testing. PM me to access the OTFM.
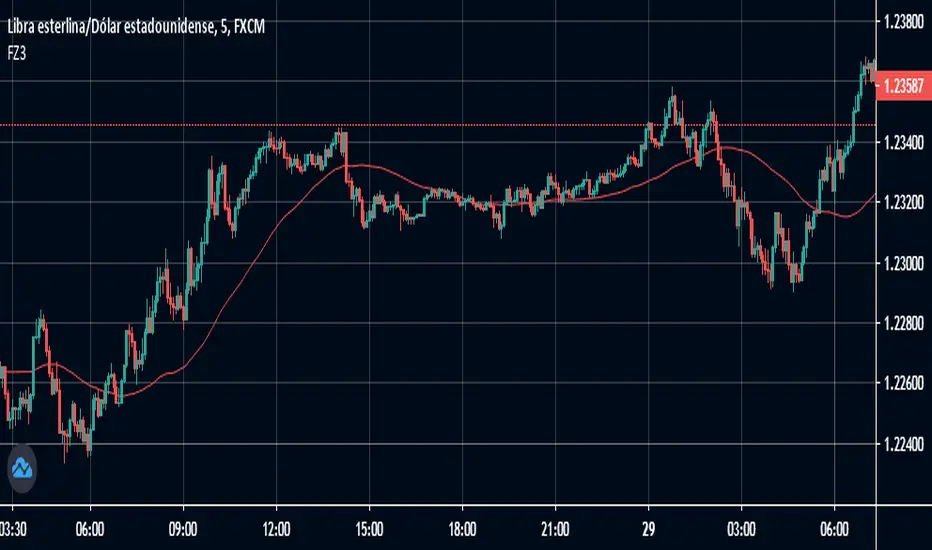
FZ3 DDemo version (02 / Jun / 20)
How to take tickets (binary options)
To take the tickets there are two ways and in both we configure the time limit to the time of the candles that we see, in medium and high volatility
• When the signal is displayed on a candlestick moving candle at the best possible point after seeing the signal
• When the signal is shown in a candle with movement against we will wait for the next candle and enter in favor of the signal
MTM S/R BounceThe MTM S/R Bounce is a Line Plotter that you can set to Plot any Timeframe. I use it somewhat as a Support and Resistance "Bounce" If I set the Chart to 30min and the candles are above the Yellow Daily Plotter, I use it as a Support. If the candles are Below the Yellow Daily Plotter then I use it as a resistance and Trade Binary Options Based on the Bounce. It can be used with Other Indicators to help predict the direction of the Bounce.
PM me to obtain Access to this Indicator

EMA200 with alerts before touchingInitial version: provide alert when price is in range before it touches ema.
Used for Binary Option to enter rejection from EMA200.
Why Jason200?
It's a legitimate request from Jason Estudillo.

Trig's Law 2.0This script uses a combination of candlestick patterns and indicators to produce signals that indicate potential trade opportunities for binary options traders.
These signals are meant to serve as additional confirmation.
Best suited for EURNZD pair on the 5min and 3min timeframes.
In the settings menu, you will see a list of pattern-based signals you can choose to have displayed on the chart.
ideally should wait for the signal candle to close before entering any trade.

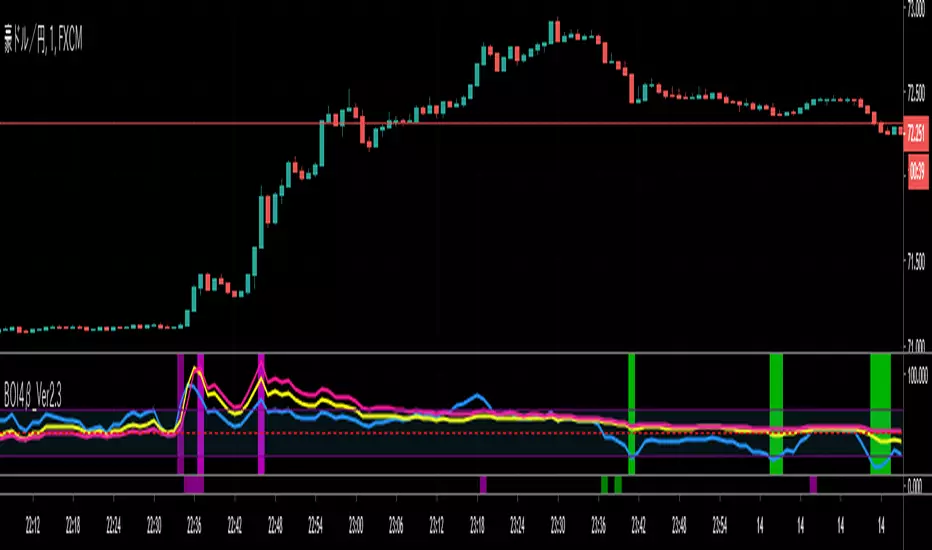
yutas_BOindicator_β1_simpleVer.1.0
・High-low sign indicator for binary option only. (β_simple version)
・Signs are displayed where repulsion is likely to occur on special oscillators.
・You can expect a rebound in the next candle after you sign.
・The filter can be in a certain numerical range.
・We recommend cross-yen for currency pairs.
・バイナリーオプション専用ハイローサインインジケーター。 (ベータシンプルバージョン)
・特殊なオシレーターでの反発しやすい所にサインを表示します。
・サインが出た次のローソクでの反発が期待できます。
・フィルターとして一定数値範囲内という条件も可能。
・通貨ペアはクロス円がオススメです。

L&S PROFIT SCALP Indicator for scalp trades for TF 1-15 minutes. 1-4 signals per day depending on the currency pair. Suitable for all crypto exchanges, Forex, binary options. Signals+ take profit Levels.

Stochastic binary option styleUsing Time Frames For Trend – You can also use different time frames to determine trends with stochastic. To do this you will need to use two different time frame charts, I like to use the weekly/daily or daily/hourly combination depending on the asset. Weekly/daily works well with stocks and indices while I prefer the shorter time frame for currency and commodities. This is how it works; stochastic on the longer term chart sets trend, stochastic on the shorter term chart gives the signal. If, on the weekly chart, stochastic is pointing up then you would trade bullish signals on the daily charts. Or if using the daily/hourly combo the stochastic on the daily would set trend while signals would come from the hourly chart.
Green color bar and background means k is > d, the crowd is bullish (trend is bullish, a bullish crossover is happened), red is the contrary (bears are the leaders)
Credit to Michael Hodges

TradingView's Technical AnalysisAll indicators used on the Technical Analysis Summary from TradingView, composed with oscillators and moving averages. Sell and strong sell will represent more indicators showing sell signals. Buy and strong buy will represent more indicators showing buy signals. A white bar will show neutral signal (don't trade). This can be good for binary options or scalping on small time frames, but also very good on higher times for forex. The signal will appear on the candle before, so wait for the new candle to appear to see what direction the signal will indicate.

BOSS Smooth Stochastic-RSI And RSI Oscillators With Alerts THE BEST FOREX, BINARY OPTIONS, STOCK AND CRYPTO INDICATORS FOR TRADINGVIEW.COM
Our Smooth Stochastic RSI indicator and our RSI indicator all combined in one!
BACKGROUND AND BAR COLOR
Green=BULLISH
Yellow= NEUTRAL/TRANSITIONAL
Red= BEARISH
ALERTS
GET ALERTS FOR BULLISH AND BEARISH CROSSOVERS ON STOCHASTIC RSI
GET ALERTS WHEN RSI LINE IS GREEN AND RED

BOSS Automatic Trendlines and Support Zones IndicatorTHE BEST FOREX, BINARY OPTIONS, STOCK AND CRYPTO INDICATORS FOR TRADINGVIEW.COM
Our auto-trendlines indicator and our support and resistance zones indicator with Fast and Slow EMA's all combined in one!
TrendLines
Trendlines when drawn properly make an excellent tool for traders. Used improperly though, they become ineffective and even counterproductive, resulting in a belief that prices have made a reversal when they really haven't, or that a trend has strength when price action suggests it doesn't.
The Boss Auto Trendline Indicator draws the trendlines automatically, and now you can effectively use trendlines as part of your trading strategy.
Trendlines highlight a trend or range (sideways movement). A trendline connects swing lows, where the low is lower than the surrounding prices, and swing highs in price. When the price rises, the swing lows rise.
Red Lines & Dots.
Connecting these lows with a line results in an ascending trendline , showing you that the trend is up. A trendline can also be drawn along the swing highs. This shows the angle of ascent, and the strength of the price move, whether strongly higher or not.
Green Lines & Dots
When the price falls, the swing highs fall. Connecting these highs with a line results in a descending trendline , illustrating the downward trend. A trendline can also be drawn along the swing lows. This shows the angle of descent and the strength of the downward price movement.
Support & Resistance Zones
Green = Support Zones
Red = Resistance Zones
The basic trading method for using support and resistance is to buy/long near support in uptrends, and to sell/short near resistance in downtrends.
Fast & Slow EMA's
Trend Following - you essentially use the EMA to track the primary trend. If a trading pair does not close beyond the average - you stay in the trade.
Moving Average Crosses - by using two different exponential moving average crosses you can generate buy and/or sell signals. For example, you can have a fast average cross a slow average to trigger a trade signal.
Dynamic Support and Resistance - EMA periods like the 21 or 55 can act as support and resistance zones.

yutas_BOindicator4βver.1.0
High-low sign indicator for binary option only. (sample version)
バイナリーオプション専用ハイローサインインジケーター。 (お試し用)